
On This Page
- Prenatal care X Race Indicators
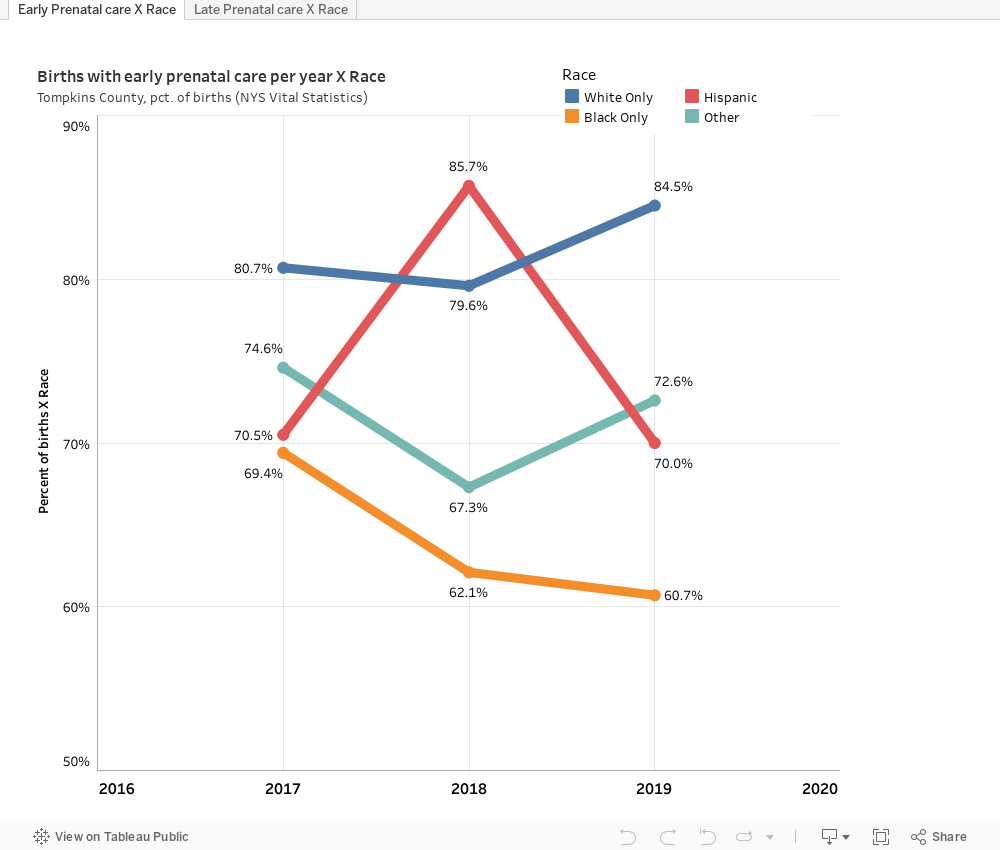
- Prenatal care X Race Trends
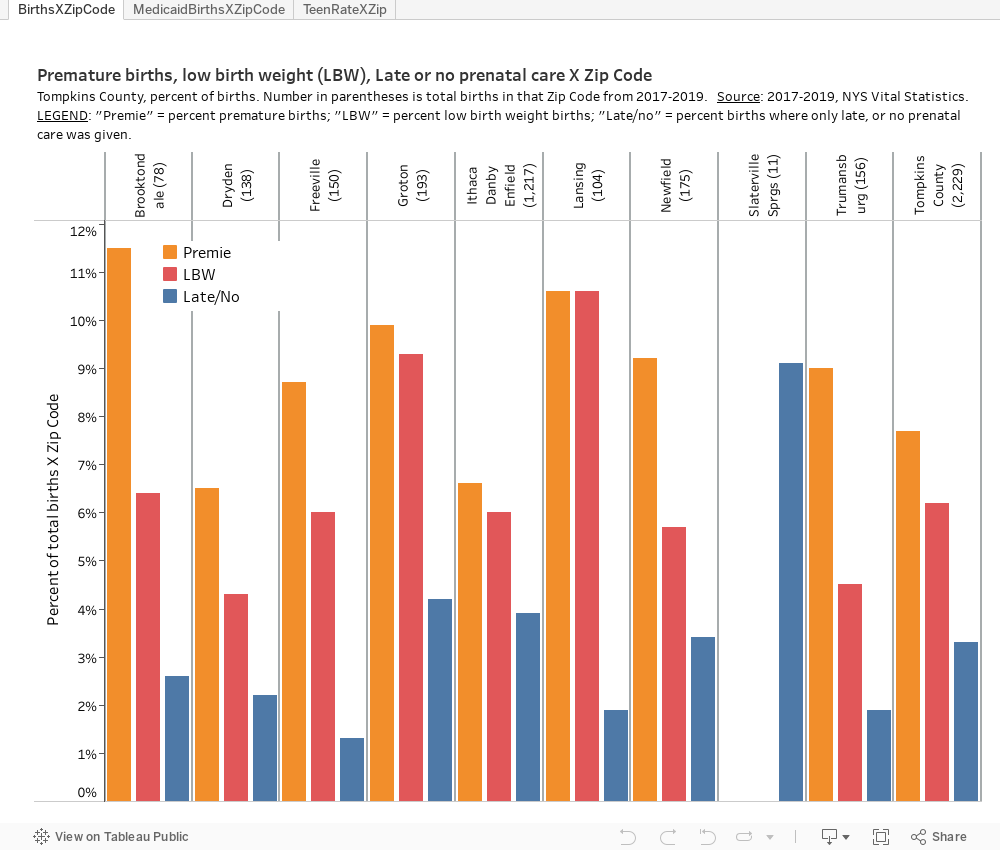
- Births X Zip code
- How to get the most out of our graphs
| NYS Prevention Agenda Priority | Focus Area | Goal | At-Risk Populations Addressed |
|---|---|---|---|
|
Promote Healthy Women, Infants, & Children |
HWIC-2: Perinatal and Infant Health HWIC-4: Cross Cutting Healthy Women, Infants, & Children |
HWIC-2.1: 2.1: Reduce infant mortality & morbidity HWIC-4.1: Reduce racial, ethnic, economic, and geographic disparities in maternal and child health outcomes, and promote health equity for maternal and child health populations |
Poverty (Medicaid recipient); Race; Residence /geography |
Focus Area 2: Perinatal and Infant Health
Focus Area 4: Cross Cutting Healthy Women, Infants, & Children
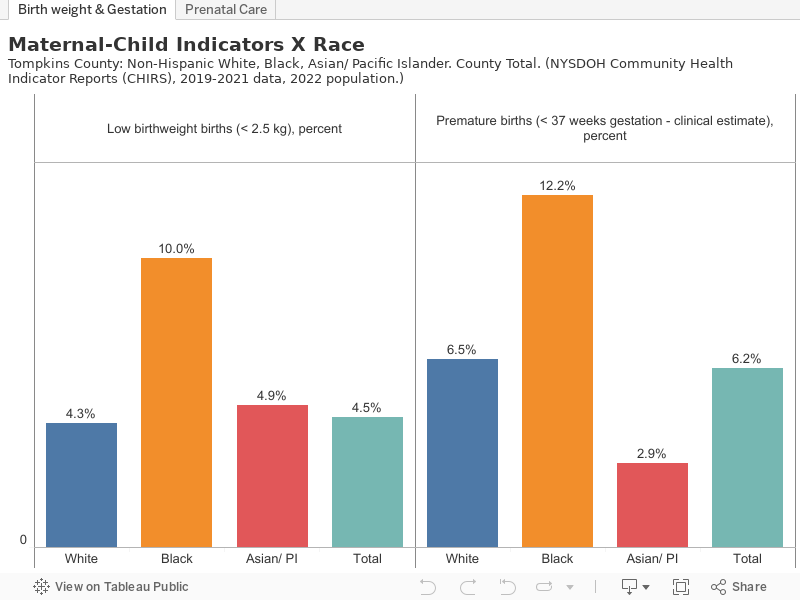
3-year data 2019–2021
3-year data 2017–2019
3-year data 2017–2019
How to get the most out of our graphs.
The bar graphs and line graphs displayed on this page were created in Tableau and have features that make viewing easier.
- Click on any item in the legend to show only those values. The other values will be dimmed.
- Mouse over any data point (e.g., bar or point in a line graph) and the value of that data point will be displayed.
- There are multiple tabs across the top in some visualizations. Check the upper left corner

- Use the Tableau bar at the base of the graph to share it, download it, or open it in a new tab. Click on the Tableau logo at the left end of the graph to open it in Tableau Public.