
THE HEALTH AND WELL-BEING of our community is our top priority. Tompkins County Health Department (TCHD) is working closely with community partners to prevent and respond to the evolving novel Coronavirus (COVID-19) outbreak.
April 2020-December 2022
The TCWH instituted a new reporting dashboard for Tompkins County's COVID-19 data, effective December 21, 2022. The daily table maintained by the TCHD since April 2020 will be removed from the homepage. The COVID-19 Data Page (this page) will remain, though it will no longer be updated.
 On This Page
- Trend graphs: vaccinations, active cases, total cases, new cases, 7-day averages
- Community Level
- Demographic distribution of cases and vaccinations
- Homepage data Table explained: Where the numbers come from and what they mean
Dashboards from local, NYS, CDC sources
- College Dashboards:
- Cayuga Health System (CHS): Coronavirus Tracking
- New York State: COVID-19 Data in New York (testing, cases, hospitalizations, vaccinations; statewide, regional, county level)
- New York State's COVID-19 metrics: Regional Dashboard | County Tracker.
- New York State: COVID-19 Report Card (Public Schools, Private Schools, Charter Schools, Higher Education Institutions, State Universities of New York)
- CDC COVID-19 County Level Data Tracker
Tompkins County data
History & Trends
Trend graphs over time are shown below. Mouse over or tap lines to show data point value.
COVID-19 Vaccinations
The graph shows the total number of vaccinations reported by New York State Vaccine Tracker for Tompkins County residents, from June 1, 2021 to the present. This represents vaccinations administered by all sources, including pharmacies, NYS-operated sites, private practices, the Tompkins County Health Department, and the Cayuga Health System in partnership with TCHD.
Total COVID-19 Vaccinations since June 1, 2021 (Tompkins County)
Click here to open this graph in a new tab. Updates may lag.
For the total number of first and second dose vaccinations administered to Tompkins County residents from February 2021 to April 2022, click here.
COVID-19 Cases
The following graphs show confirmed COVID-19 disease cases including new cases and active cases, percent of COVID-19 tests that are positive (virus detected) and source of exposure. Tompkins County residents only.
Daily new positive cases & 7-day Rolling Average
Click here to open the above graph in a new tab. Updates may lag.
For the period of July 1, 2020 to Aug 2, 2021, click here.
Total Cases + Daily Active Cases + Daily Positive Cases
Click here to open the above graph in a new tab. Daily updates may lag.
Percent Positive Tests (avg. cases /avg. tests; from 6/1/21)
Click here to open the above graph in a new tab. Daily updates may lag.
For the graph showing data from 12/1/2020, click here.
Vaccination Status of Positive Cases
Reporting of Vaccination Status of Positive Cases has been discontinued as of 2/8/22 due to increasing unknowns in available data. The graph is still available here.
Community Level
The CDC has revised its advisory metrics to focus on new hospitalizations and hospital capacity to determine the Community Level classification as low, medium, or high.
- CDC Resources
The CDC looks at the combination of three metrics to determine the COVID-19 community level.
- new COVID-19 hospital admissions per 100,000 population in the past 7 days,
- the percent of staffed inpatient hospital beds occupied by COVID-19 patients, and
- total new COVID-19 cases per 100,000 population in the past 7 days
New COVID-19 admissions and the percent of staffed inpatient beds occupied represent the current potential for strain on the health system. Data on new cases acts as an early warning indicator of potential increases in health system strain in the event of a COVID-19 surge.
The COVID-19 community level is determined by the higher of the new admissions and inpatient beds metrics, as defined by the current level of new cases per 100,000 population in the past 7 days (under 200, or 200+). The metrics for classifying as low, medium, or high are defined in the table below.
| New COVID-19 Cases (7-day total per 100K) | Community Level Indicators |
Low |
Medium* |
High |
|
Fewer than 200 new cases total over the last 7 days per 100K population. |
New COVID-19 hospital admissions per 100,000 population (7-day total) |
<10.0 |
10.0-19.9 |
≥20.0 |
|
Percent of staffed inpatient hospital beds occupied by COVID-19 patients (7-day average) |
<10.0% |
10.0-14.9% |
≥15.0% |
|
|
More than 200 new cases total over the last 7 days per 100K population. |
New COVID-19 hospital admissions per 100,000 population (7-day total) |
NA |
<10.0 |
≥10.0 |
|
Percent of staffed inpatient hospital beds occupied by COVID-19 patients (7-day average) |
NA |
<10.0% |
≥10.0% |
*Within the guidance for Medium level, community members are encouraged to continue to remain cautious:
- seek testing if you experience symptoms or have a known exposure;
- get vaccinated and stay up to date on your vaccination status, including seeking additional booster doses when eligible; and
- wear a high-quality mask for 10 days after a known exposure and other times when in public settings if you choose to do so.
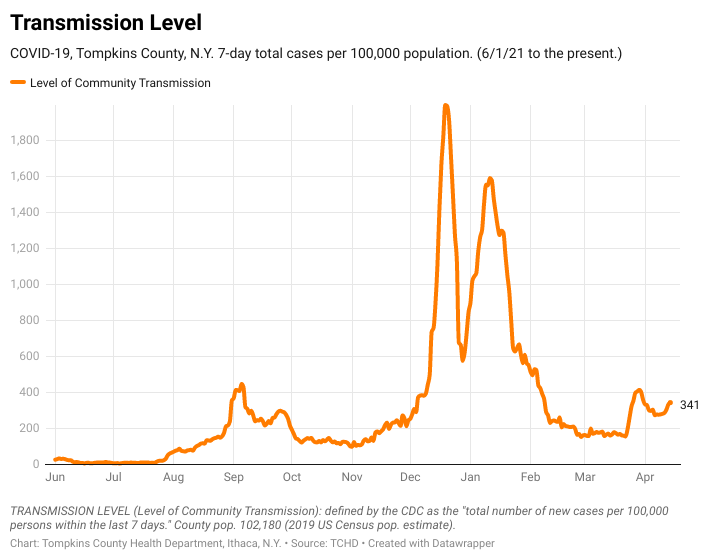 Level of Community Transmission
Click here to open the current graph from TCHD data (6/1/2021 to 12/20/2022). The level is calculated as the 7-day total cases per 100,000 population. Daily updates may lag.
For the period of July 1, 2020 to Aug 2, 2021 click here.
Source of COVID-19 Exposure
Reporting of Source of Exposure data has been discontinued as of 1/25/22. The graph is still available here.
Demographics:
Hospitalizations: Vaccination status of COVID-19 positive patients
Tompkins County residents COVID-19 positive when admitted to Cayuga Medical Center. Data since 8/1/21. Vaccination status is at time of admission. Source: Cayuga Health System, collated by TCHD.
Hospitalizations: Age and vaccination status of COVID-19 positive hospitalized individuals.
Click here to open the above graph in a new tab. Updates weekly.
Hospitalizations: Month individual admitted to CMC.
Click here to open the above graph in a new tab.
EXPLANATION OF CASE VACCINATION STATUS: Fully Vaccinated-- the date of the case's COVID-19 test was 2+ weeks after their second dose in a 2-dose series, or 2+ weeks after their single-dose vaccine. Not Fully Vaccinated-- case is unvaccinated, or the test date is <2 weeks after full vaccination series is completed.
Deaths attributed to COVID-19, Tompkins County residents
Age and vaccination status of Tompkins County residents whose deaths were attributed to COVID-19 from February 1, 2021
Click here to open the above graph in a new tab. Bi-weekly updates may lag.
Deaths of Tompkins County residents per month from February 1, 2021
Click here to open the above graph in a new tab. Updates monthly.
Confirmed Positive Cases
Age distribution of residents who were confirmed COVID-19 positive
Click here to open the above graph in a new tab.
Race distribution of residents who were confirmed COVID-19 positive
Click here to open the above graph in a new tab.
Ethnic distribution of residents who were confirmed COVID-19 positive
Click here to open the above graph in a new tab.
Vaccinated Individuals in Tompkins County
COVID-19 Vaccinations, Individuals with one dose or more, Tompkins County residents. Source: NYSDOH.
Age distribution of vaccinated residents
Click here to open the above graph in a new tab.
Race distribution of vaccinated residents
Click here to open the above graph in a new tab.
Ethnic distribution of vaccinated residents
Click here to open the above graph in a new tab.
Daily Data for Covid-19 Explained
Where the data comes from and how the numbers are calculated
Updated data reporting is posted at the top of this page.

Click the image to open a larger image
Click here to open and download a PDF of this graphic
Or review the explanations in the outline below.
TCHD: Tompkins County Health Department | CHS: Cayuga Health System
ECLRS: Electronic Clinical Laboratory Report System (NYSDOH)
(Updated: February 1, 2022)
Active COVID-19 Hospitalizations
CHS reports all COVID-related hospitalizations daily to TCHD. TCHD then reports active COVID-19 patients — those being monitored during the isolation period. Patients who are released from isolation, but are still recovering in the hospital are not included in this number.
Total TC Resident Deaths
The Medical Examiner reports this information to TCHD. As of 1/25/21, TCHD is no longer reporting non-resident deaths. The counties of residence report these deaths.
The difference between "death data" reported by NYS and by TCHD is due to several issues. The State is likely reporting deaths of anyone who dies in Tompkins County regardless of their permanent address, whereas TCHD is reporting deaths of Tompkins County residents only. We are basing our reporting on death certificates, however we do not receive notification of deaths of residents who are not in Tompkins County at the time of death.
Total Tests for COVID-19
Total tests reported in ECLRS, the Electronic Clinical Laboratory Report System at the NYSDOH, for Tompkins County residents.
Daily Tests
Daily tests are positive and negative test results in ECLRS. The number reported here is for the previous day.
New Positive Cases
TCHD reports new unique positive cases daily based on a secure State system. TCHD nurses follow-up with any individual who has a positive test result and conducts a contact investigation.
Total Positive Cases
This is a cumulative number of unique positive cases since 3/14/2020. Tompkins County residents only.
Reported Positive Self-Tests
COVID-19 positive self-test (home-test) results reported to TCHD through an online reporting form. Learn more on the self-test webpage.
Total Reported Positive Self-Tests
A cumulative total of the COVID-19 positive self-test results reported to TCHD.
Total Vaccinations (1st and 2nd doses)
Vaccination data is taken from the NYS COVID-19 Vaccine Progress to Date dashboard.